

Our Core Delivery Capabilities
Structured analytics services engineered to modernize reporting, streamline operational workflows, and deliver decisive, data‑driven clarity.

Reporting & BI Modernization
We transform and modernize fragmented corporate data into intuitive, unified executive dashboards. By modeling and structuring your core metrics, we eliminate reporting noise, latency, and manual spreadsheet consolidation.

Data & Workflow Automation
Eliminate repetitive administrative work and human error. We engineer automated data refreshes and multi-step reporting workflows that allow critical operational information to flow seamlessly across your business systems.

Analytics Support & Advisory
Gain direct access to senior-led technical execution without the overhead of extended consulting cycles. We provide precise assistance with complex data modeling, dashboard optimizations, and cross-functional analytics adoption.
Custom Analytics Solutions
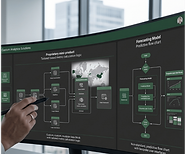
We design and deploy tailored KPI frameworks, forecasting models, and proprietary mini‑products engineered around your exact operational logic and build custom data infrastructure that adapts to your business model.
Our Consulting Delivery Framework
A structured, transparent engineering methodology designed to guarantee predictability, clear timelines, and seamless operational alignment.

1. Discovery & Alignment
We begin with a focused conversation to understand your goals, challenges, and the data outcomes you want to achieve. This ensures we design a reporting or automation solution that fits your business perfectly, without unnecessary complexity.
2. Defined Project Blueprint
You receive a clear plan outlining deliverables, timelines, and responsibilities. No ambiguity. No open‑ended consulting. Just a practical data roadmap you can trust.
3. Expert‑Led Execution
All work is executed by experts, ensuring quality, speed, and deep technical analytics expertise throughout the project. You always work directly with the expert overseeing your project.
4. Review & Validation
We walk through the solution together, refine what’s needed, and ensure your dashboards and data models align with your real‑world workflows.
5. Handover & Confident Adoption
You receive clear documentation, training (if needed), and a clean handover so your team can adopt the system confidently from day one. Optional ongoing support is available for teams that want continued guidance.
Real‑World Results
Delivering practical analytics solutions that eliminate manual bottlenecks, strengthen decision‑making, and help teams operate with clarity and confidence.
Use Case 1:
Sector: Retail & Operations
Modernizing Reporting for a Multi‑Location Retail Business
Deployed Stack: Microsoft Power BI | Excel |
Automated Insights for Faster Decisions
The Challenge
A rapidly growing retail business was spending over 8 hours each week manually compiling fragmented sales, inventory, and operational metrics. Because data lived in disconnected spreadsheets, reporting was inconsistent and leadership lacked a reliable daily view of store performance.
The Solution
Using our structured delivery framework, we built a unified reporting system that automated data refreshes, standardized core KPIs, and delivered clean dashboards with synchronized store-level and regional insights.
The Outcome
-
Reporting Time Reduced: Weekly data preparation dropped from 8 hours to under 30 minutes.
-
Real‑Time Visibility: Leadership gained immediate clarity on sales trends and stock levels.
-
Better Decisions: Store managers shifted to confident, data‑backed operational choices.
-
Smooth Adoption: Manual errors disappeared, and the team fully adopted the new workflow within days.


The Challenge
A mid‑sized services company relied on manual spreadsheets to prepare monthly finance, operations, and performance reports. Each cycle took several days, involved multiple teams, and produced inconsistent numbers due to versioning issues and manual data entry.
The Solution
Using our structured delivery framework, we built an automated reporting workflow that consolidated finance, operations, and HR data into a single, reliable dataset. We designed dashboards that provided leadership with clear visibility into revenue, margins, utilization, and operational KPIs with automatic weekly data refresh.
The Outcome
-
Reporting Time Reduced: Monthly reporting dropped from 3 days to under 1 hour.
-
Unified View: Leadership gained a single source of truth for financial and operational performance.
-
Faster Reviews: Month‑end discussions became more focused and data‑driven.
-
Error‑Free Reporting: Manual reconciliation issues were eliminated.


Use Case 2:
Sector: Professional Services
Automating Monthly Finance & Operations Reporting
Deployed Stack: Python | SQL | Microsoft Power BI
Automated Data Pipeline
Use Case 3:
Sector: Logistics & Supply Chain
Building a KPI Framework for a Logistics & Distribution Company
Deployed Stack: Tableau | SQL
Standardized KPI Models
The Challenge
A logistics company struggled with inconsistent KPIs across departments. Operations, sales, and warehouse teams each tracked their own metrics, leading to conflicting reports and unclear performance benchmarks.
The Solution
We developed a unified KPI framework that standardized definitions, calculations, and reporting logic across the organization. Dashboards were built to show on‑time delivery, order accuracy, warehouse efficiency, and customer performance, all aligned to a unified data model.
The Outcome
-
Consistent Metrics: A single source of truth for all operational KPIs.
-
Aligned Teams: Departments began working toward shared performance goals.
-
Clear Insights: Leadership gained clarity on performance drivers and bottlenecks.
-
Better Decisions: Operational decisions became faster and more consistent.

